


Monitoring tools provided to all IXcloud® users.
Reason for Monitoring

There is a need to monitor the cloud server to ensure service continuity without any performance issues. When you are negligent in monitoring, you will likely overlook issues that may lead to major but preventable problems. By using the notification function of the monitoring tool on IXcloud, you can set a threshold in advance and be alerted immediately when the threshold is reached.
The situation with the infrastructure should be checked in real time to ensure service stability. If there are unanticipated complaints about the service, it is important to promptly identify the cause and address the problem.
It is possible to judge whether the scope of cloud resources in use is suitable for providing stable services by examining the monitoring data. It is vital that you implement the most efficient operating strategy that involves supplementing inadequate resources and minimizing idle resources.
Monitoring Methods

All IXcloud users are provided with a free monitoring tool based on the project created. Users can check the related data such as created resources, usage, events, etc. on the monitoring page. (Please note that the access to the monitoring page is provided by an e-mail.)
Contact an Expert
Monitoring Analysis Matrix

The cloud infrastructure status is analyzed based on diverse matrices. Also, a wide variety of resources including instances, servers, and networks are monitored in real time, and the administrator is notified of any unusual events.
• CPU Total Used
• CPU Load
• CPU User time
• CPU Iowait time
• CPU Steal Time
• CPU System
• Total Memory
• Used Memory
• Network Traffic(In/Out)
• Network PPS(In/Out)
• Ping Check
• Total Disk
• Used Disk
• Disk IOPS(R/W)
• Disk Throughput(R/W)
• CPU on each Process
• Memory on each Process
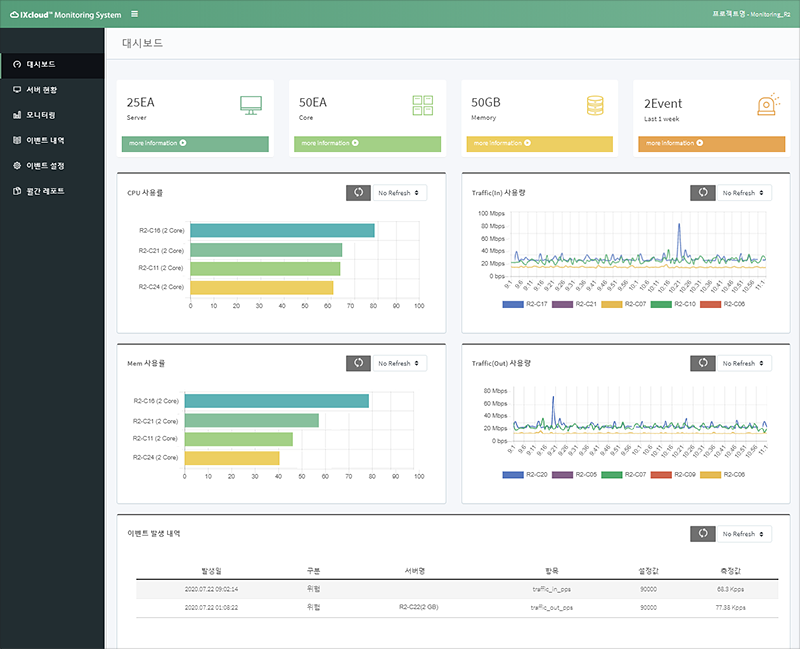
Monitoring Pages
- Dashboard It provides the current situation with the server resources in real time.
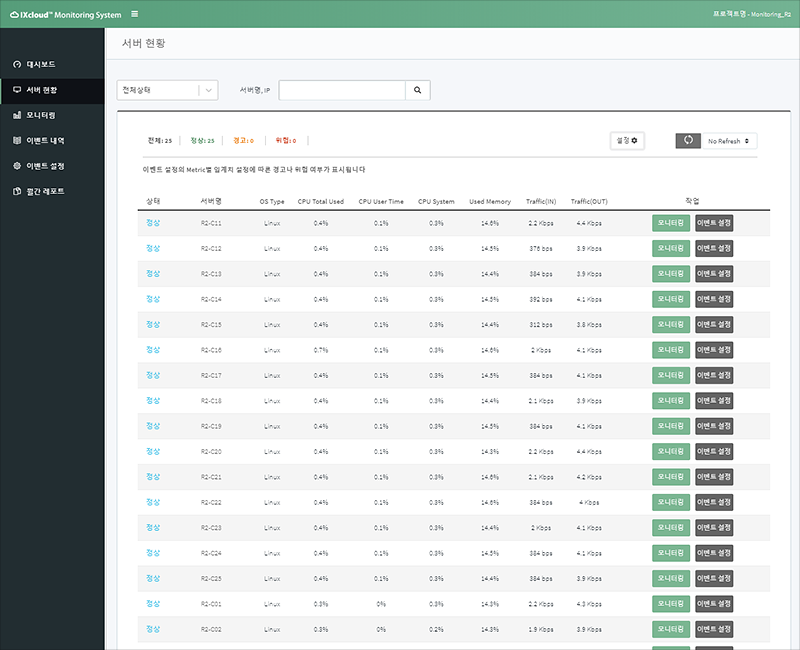
- Service Status It provides information on the current status of the server(s).
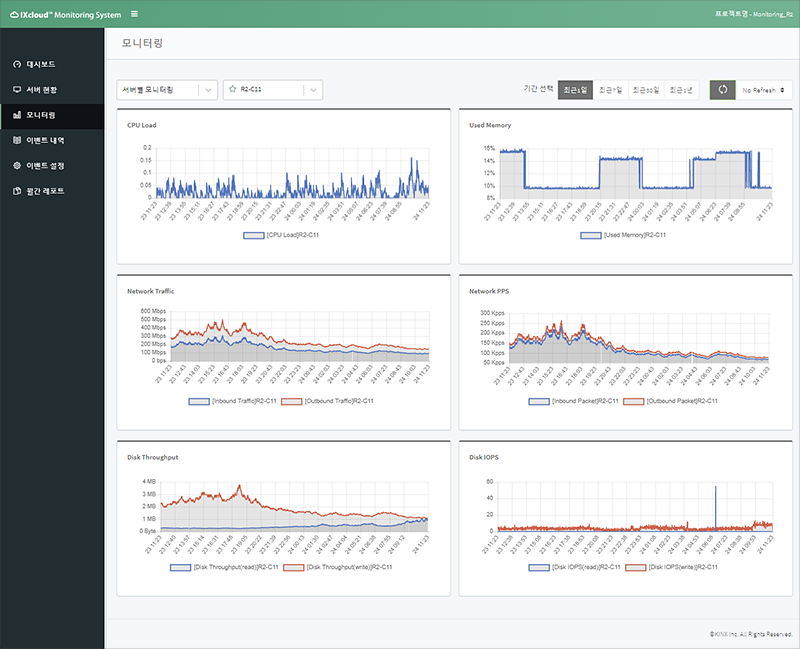
- Monitoring You can carry out monitoring by server, resource, or process.
Features
Performance Monitoring
It provides indicators related to the CPU usage, memory, and disk usage, traffic, and other aspects of server performance.
Notification
When any of the predesignated events occur, the user will be alerted via e-mail or SMS (text message).
Event Management
Users can manage event notifications by setting the threshold for the CPU, memory, network, and disk resources in advance.
Monthly Analysis Report
A monthly analysis report consists of a monthly summary as well as the instance/volume quantity used, traffic, event history, current status of all resources, etc.